|
|||
| Updates | ||
|
|
||
| Documentation | ||
|
|
||
| Support & Training | ||
|
|
||
| Community | ||
|
|||||||||||||||
|
||||
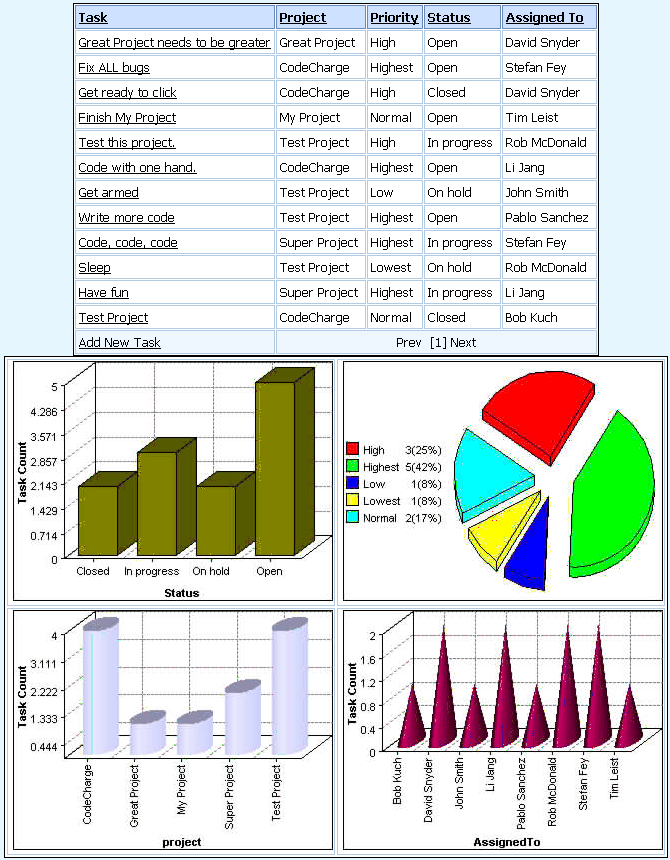
Download Project Files - The Project should be connected to the Intranet example database that comes with CodeCharge Studio. In Cold Fusion MX, the CFChart tag in conjunction with the CFChartSeries tag can be used to generate and render graphic charts that are based on information drawn from database queries. This means that you can produce charts to go along with the grid forms you create in CodeCharge Studio. This is made possible by the use of Query of Queries which are special Cold Fusion queries that are based on existing queries. As such, you can use the default query for a grid form to produce a Query of Queries which is then used to create a chart. In certain situations where the query fits the bill, you can produce a chart based on the original query used for a grid instead of producing a query of queries. In this article, we will demonstrate how to enhance the Default page of the Task Manager example solution such that it shows four graphs based on information used to create the Tasks grid. In the Task Manager example, each task is assigned a status, priority, project, as well as employee. The graphs we will produce will show the distribution of all the tasks based on the four properties above.
To begin the process, we will first add a table with four Label type fields which will eventually contain the charts. The idea here is that after the chart has been generated and saved to a file, we shall construct a <img> tag and use it to display the chart. This <img> tag will be the value of the Label field. The diagram below shows the table with the four Labels. Note that this is in design mode and this new table should appear below the current tasks grid in the default page.
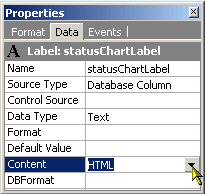
For each of the Labels above, the Content property has to be set to HTML as opposed to Text. This is so that the Label can be used to hold the contents of the <img> tag.
After setting up the Labels, we will then proceed to add the event code that will create the charts and save them to image files. Since we will be making use of the query that is used in the tasks grid form, we have to place our code in the After Execute Select event which occurs after the query has been processed. This way, we can use the existing query as the basis for the query of queries that will be contain data for the charts. The first chart to be created will be the status chart. <!---
Generate a query of queries for the status chart. ---> <!---
The CFChart and CFChartSeries tags set the properties of the chart. Note that
the CFChartSeries tag uses the Status_chart_query created above---> <cfchartseries
<!---
After the chart has been produced, the CFFile tag is used to save it to disk
so that it can later be used in a HTML <img> tag ---> The above code will thus create an image file containing the status chart. The process of creating the 3 other charts is essentially the same except that the query of queries is adjusted to retrieve the appropriate data and the grid properties are assigned appropriate names. The remaining of the code in the After Execute Select event is as follows: <!---
Generate a query of queries for the priority chart. ---> <!---
The CFChart and CFChartSeries tags set the properties of the chart. Note that
the CFChartSeries tag uses the priority_chart_query created above---> <cfchartseries <!---
After the chart has been produced, the CFFile tag is used to save it to disk
so that it can later be used in a HTML <img> tag ---> <!---
Generate a query of queries for the project chart. ---> <!---
The CFChart and CFChartSeries tags set the properties of the chart. Note that
the CFChartSeries tag uses the project_chart_query created above---> <cfchartseries <!---
After the chart has been produced, the CFFile tag is used to save it to disk
so that it can later be used in a HTML <img> tag ---> <!---
Generate a query of queries for the AssignedTo chart. ---> <!---
The CFChart and CFChartSeries tags set the properties of the chart. Note that
the CFChartSeries tag uses the AssignedTo_chart_query---> <cfchartseries <!---
After the chart has been produced, the CFFile tag is used to save it to disk
so that it can later be used in a HTML <img> tag ---> Now that we have the four charts generated to image files, the next step is to display them in the table we created earlier on for this purpose. To do this, we shall add a Retrieve Value for Control action to the Before Show event of each of the Label fields. In the Source Name property of the action, we will specify the HTML code for the <img> tag which will display the image containing the chart. For instance, for the status chart Label field, the properties of the Retrieve Value for Control action will be as follows: Control Name: statusChartLabel and the rest of the chart Label fields will be configured as follows: Control Name: priorityChartLabel Control Name: ProjectChartLabel Control Name: AssignedToChartLabel After making all the above changes, you can then generate and view the page. The output should be similar to the first image at the top of this page but the charts will vary depending on the information in the database. Conclusion: |
||||
Viewed 20809 times. Last updated: 12/16/2002 8:26:58 PM |


